
PDF , Hi-res PNG
The best way to view NSE figures is to use FREE Mathematica Player.
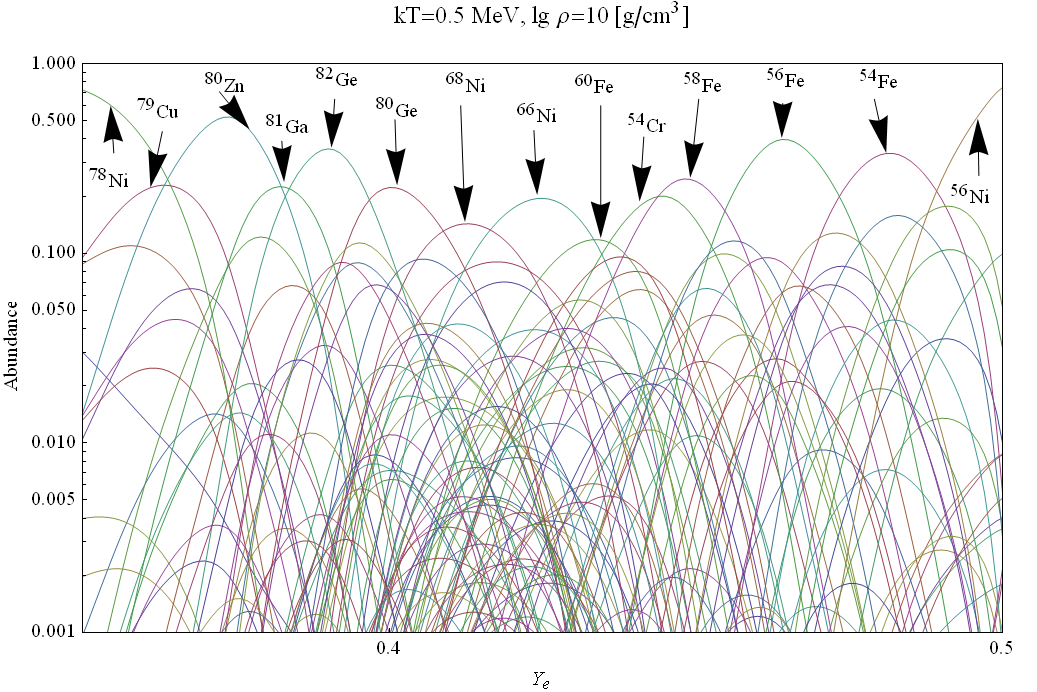
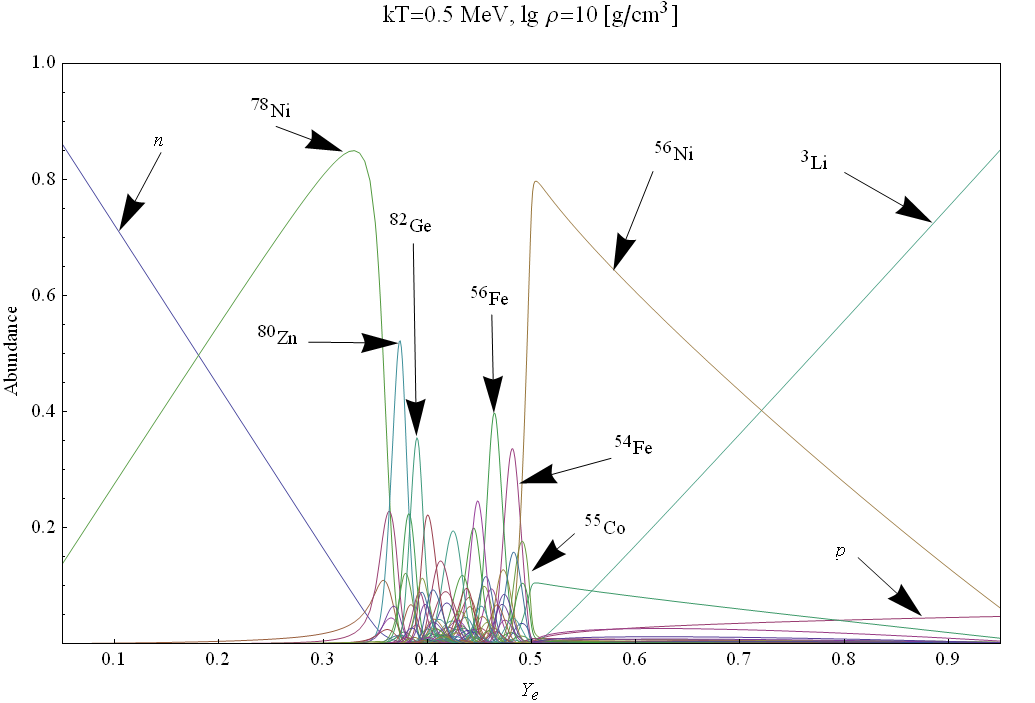
Full temperature, density and Yerange is available,
as well as all 800 nuclei. Curves are labelled interactively
if mouse is placed over line.
Mathematica Player format [nbp]
Mathematica format [nb]
NOTE1: you need FREE
Mathematica Player
to view nbp files.
NOTE2: in MATHEMATICA or Mathematica Player put mouse over on curve to view nuclide name.
NOTE3: figures are stored on WWW, sizes vary from 25 to 720 kB;
you need fast internet connection to change kT and lgrho without glitches.
NOTE4: if Mathematica or Mathematica Player show dialog window
press "Enable Dynamic" unless you have very old and slow PC.
[NOT RECOMMENDED] You can also view figures one at time using Mathematica:
go to https://th.if.uj.edu.pl/~odrzywolek/psns/Artwork/NSE/NSE_zoom/
, download figures (*.m files), open in Mathematica and press "Run package"
Mathematica Player format [nbp]
Mathematica format [nb]
NOTE: upload in progress
[NOT RECOMMENDED] You can also view figures one at time using Mathematica:
go to
https://th.if.uj.edu.pl/~odrzywolek/psns/Artwork/NSE/NSE_full_Ye/
, download figures (*.m files), open in Mathematica and press "Run package"
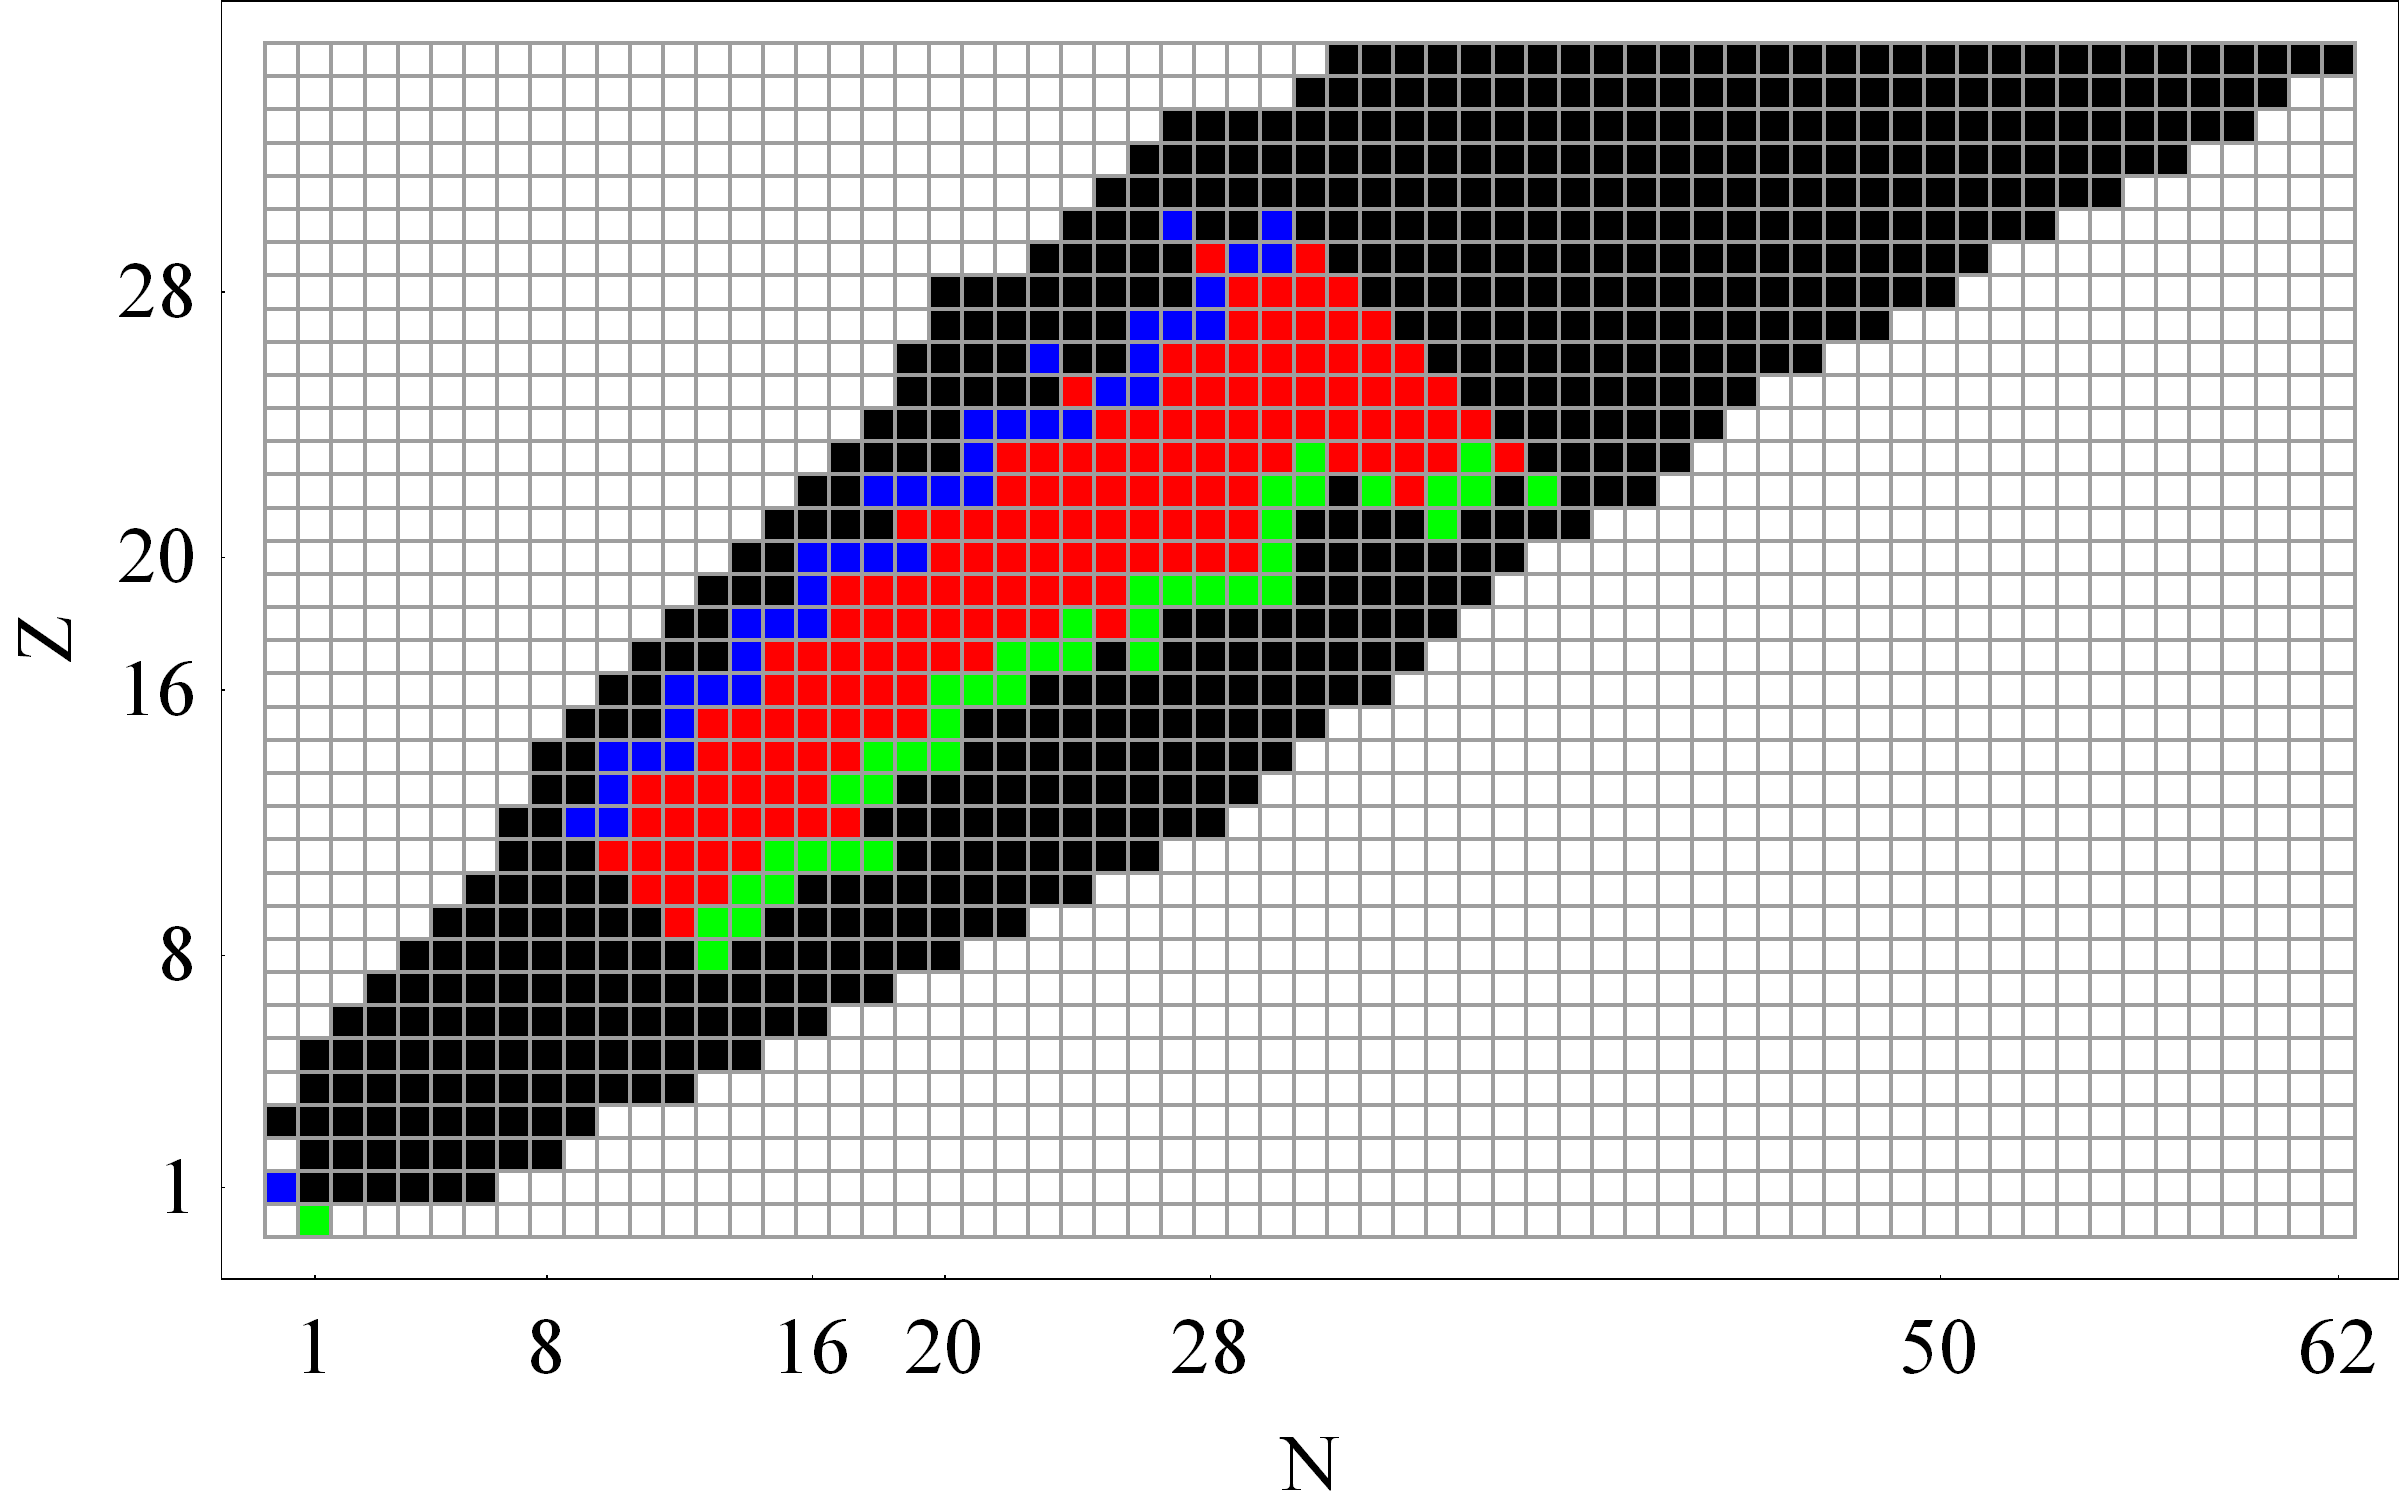
Figure below show all nuclei included in NSE ensemble.
Red squares show nuclei with known neutrino and antineutrino
emission, blue - neutrinos only, green - antineutrinos only.
FFN weak rates and Mathematica "IsotopeData" were used to prepare this figure.
PDF , Hi-res PNG
Mathematica Player format [nbp]
Mathematica format [nb]
NOTE: you need FREE
Mathematica Player
to view nbp files.
NOTE: in MATHEMATICA or Mathematica Player put mouse over on curve to view nuclide name.
PDF with attached nb file, no curve labels! [PDF+nb]
Mathematica Player format [nbp]
Mathematica format [nb]
NOTE: you need FREE
Mathematica Player
to view nbp files.
NOTE: in MATHEMATICA or Mathematica Player put mouse over on curve to view nuclide name.
PDF with attached nb file, no curve labels! [PDF+nb]